Unlimited Report creation is included with your monthly subscription at no extra cost.
The date range of data you can view and export will depend on your subscription
Reports data can be exported into the following formats:

Power Reports are an add-on feature that provides your team with more powerful reporting capabilities.
Ready to get started with Reports? Open Agorapulse in another tab and follow along!
1- Viewing Reports on the web
Click on any social profile’s reports tab and choose a time period to analyze.

Audience Metrics help you discover your reach and growth potential.

They also show you how this profile has been engaging over time.

And, how your hashtag strategy is performing.

If you attach labels to audience content in your inbox or the posts you publish, you’ll see a breakdown of those labels in your Audience metrics.

Return on investment is a feature specific to Facebook. Click ‘settings’ to turn this feature on and adjust KPI values.

You’ll find the ROI metric table at the bottom of your Facebook profile’s Audience metrics and you can readjust the values there.

Global content metrics reveal the performance of this profile’s publishing strategy over time and provide publishing recommendations along with a snapshot of your top content.

Content performance metrics drill down to show performance per post. Click on any category, such as ‘engagement’ to bring the highest performers to the top.

You can use your content report to find and republish your most engaging content. Click here for a walkthrough on duplicating your highest performing posts.
Community Management Metrics provide a report on your efforts as individuals and as a team.
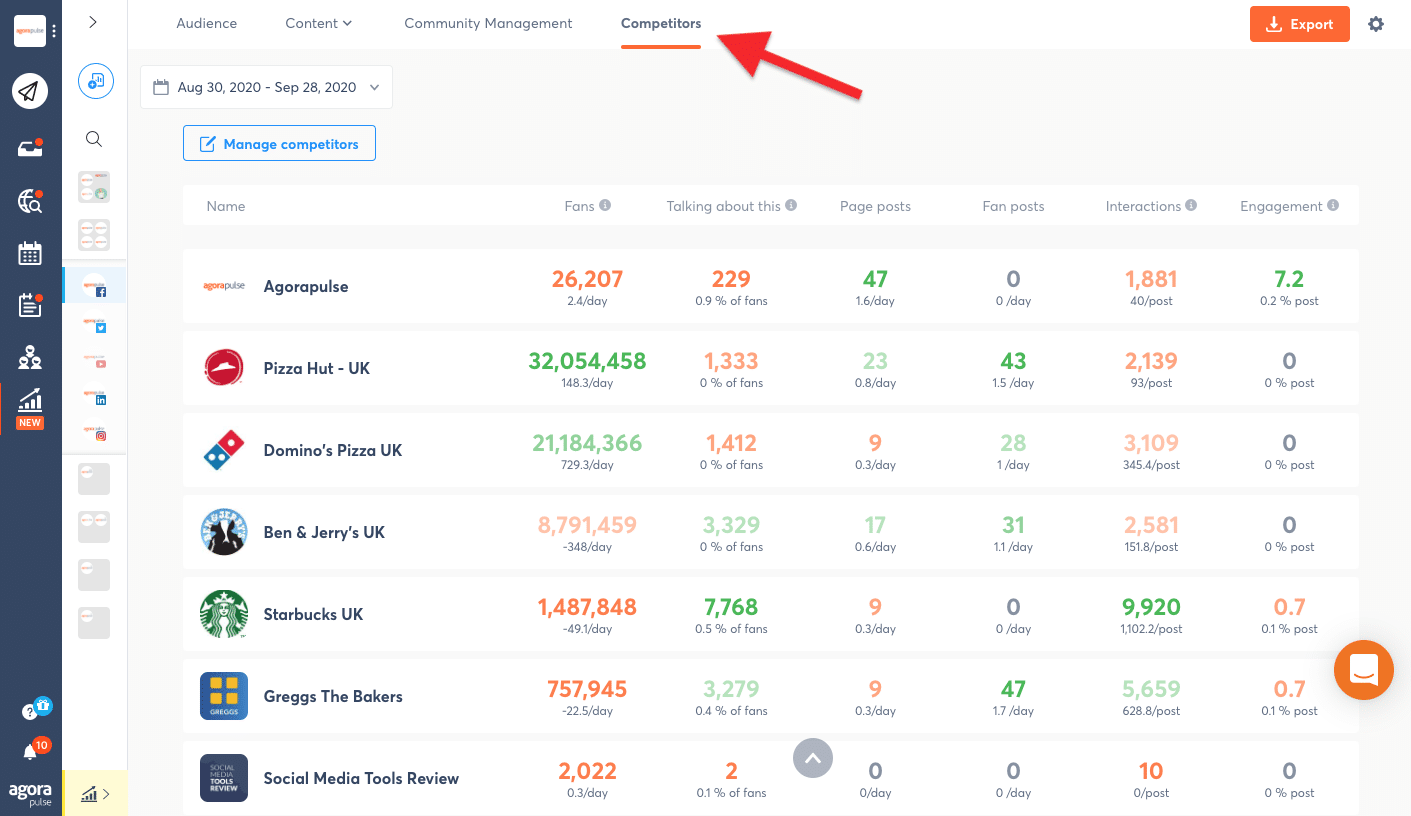
Competitive analysis is a feature specific to Facebook profiles. 1 free competitor is included with your subscription. Each additional competitor will cost $5 (USD or Euro).
Click ‘Competitors’ within a Facebook profile’s report to view your competitive analysis table. We’ve included these generic competitors to show you how the Competitors feature will work. You can add your specific competitors (or successful Facebook pages) here.

NOTE: Not available during free trial. Competitors incur an additional monthly cost of $5 (USD or Euro)
Facebook competitive analysis data is updated once every 24 hours.
You can compare your Twitter profiles’ performances to specific competitors with the free Twitter Report Card.
Twitter Report Card – https://analytics.agorapulse.com/
3 – Exporting a Report
Click on any social profile’s Reports tab. From here you can scroll down to see all your metrics for this profile or export a report. Let’s export a report first.
Choose the period of time you want to analyze.

Click “Export” to begin.

Then choose from one of the available formats.

4 – Power Reports
Power Reports are an add-on feature that provides your team with more powerful reporting capabilities. Power Reports enable you to:
- Create and export a custom report combining profiles from multiple networks with only the metrics you choose.
- Schedule reports to be delivered to you, your team or clients automatically on a regular basis.
- Select custom comparison periods. For example, you can compare Fall 2020 with Spring 2019.
- Export a single profile’s report in PowerPoint format.
Samia will walk you through how to set up Power Reports for your team and show you everything they can do in the 5-minute video below.
Congratulations! Your reports are really going to help your social media gameplan!
Click here to export a report
The video below shows you around your new reporting tools in a minute and a half.